
Overview
How can simulated personas help teams explore new ideas, compare alternatives, and understand how different people might respond? In our first MatrAIx technical blog, we highlight one application of MatrAIx’s broader capabilities: designing and running simulation experiments for real-world use cases.
We have received a wide range of requests from individuals and organizations around the world, spanning multiple application fields: healthcare and well-being, marketing and consumer research, technology and product design, social and organizational research, and scientific research and decision support. Across these studies, we explore how simulated users react to different products, navigate alternative website designs, interact with AI assistants, and choose between competing offers. Each case connects these simulated behaviors to a practical question that a requester wants to understand.
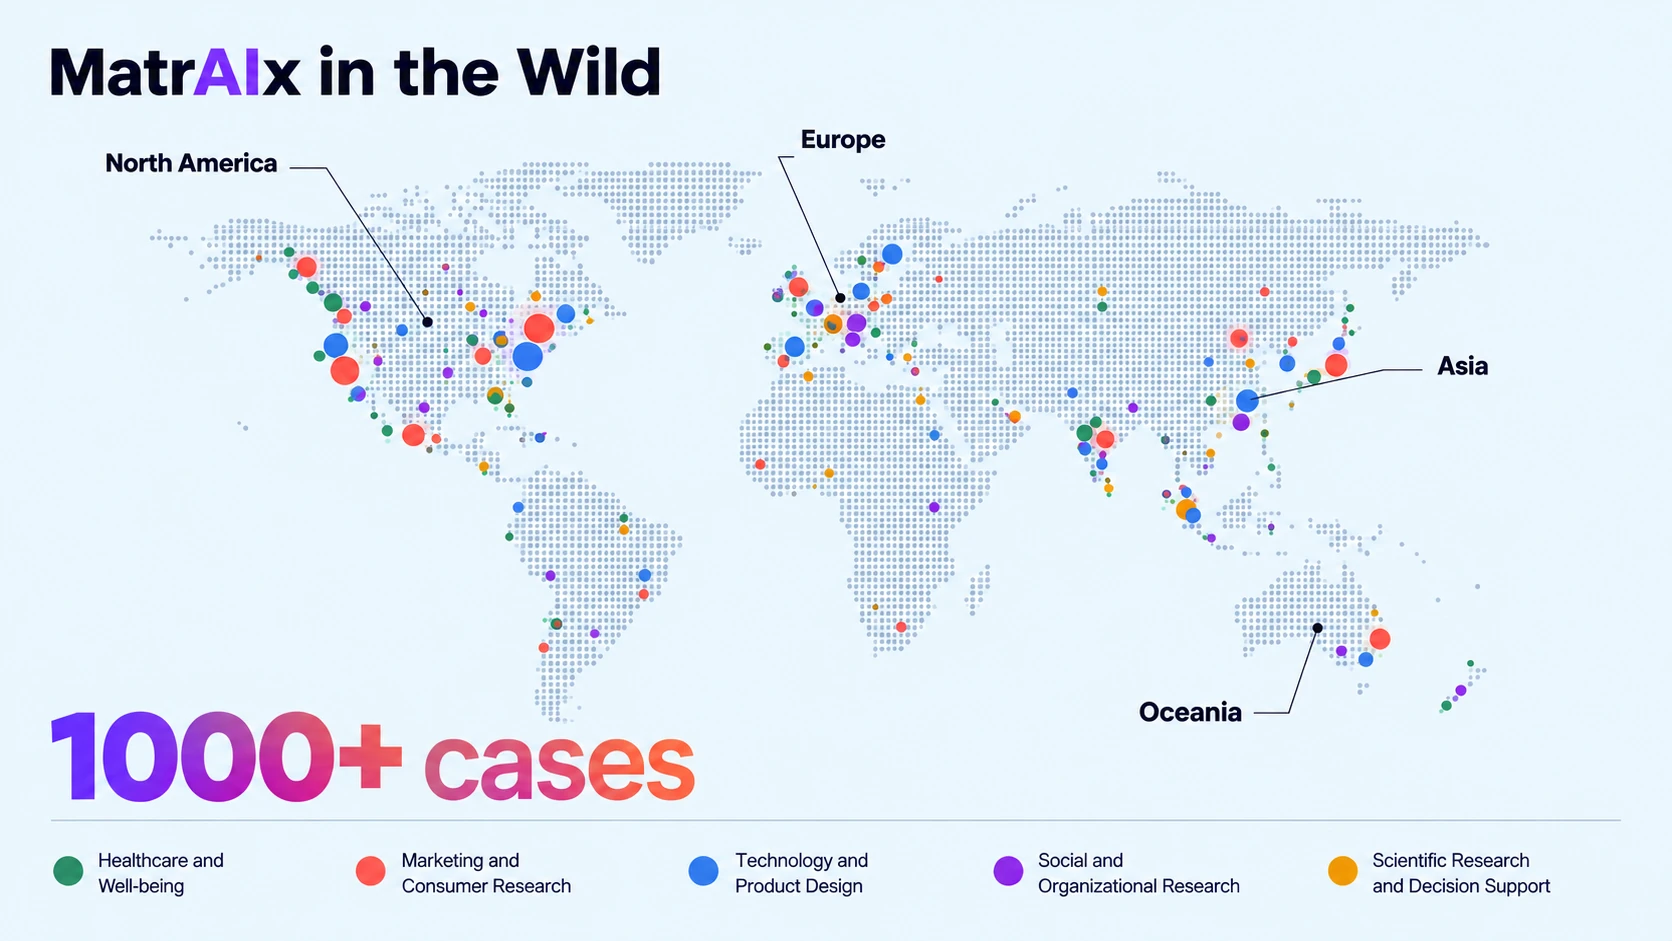
In this blog, drawing on these real use cases, we walk through how a request from a design partner is turned into a structured experiment: from defining who to simulate, preparing what they interact with, to deciding what to measure. We show how our results provide practical business insights and how we assess the reliability of these insights.
MatrAIx in the Wild: Real Requests, Practical Possibilities
Before turning to how we design and run these experiments, we start with three representative cases. Each begins with something a design partner wants to understand before making their next decision.
These spotlights connect real requests with simulated findings and the decisions they can inform. Identifying details are omitted to protect our design partners’ privacy.
Subscription Pricing: Looking Beyond the Introductory Offer

The request. Explore how prospective subscribers respond to subscription offers with different introductory prices.
What the simulation revealed. Simulated prospective subscribers declined even deeply discounted introductory offers, often raising concerns about recurring payments in their generated explanations.
What it can inform. Whether changes to the ongoing commitment, payment frequency, or cancellation terms could make the offer more appealing alongside a lower introductory price.
Professional Networking: Understanding Hesitation at Signup

The request. Explore how prospective users navigate signup on a professional networking platform and what makes them hesitate.
What the simulation revealed. Simulated users explored the signup entry point but expressed concerns about identity verification, data handling, and what would happen after registration.
What it can inform. Which explanations to make available before asking users to register, including why personal information is needed, how it will be used, and what users can expect next.
Workplace Risk: Looking Beyond the Team Average

The request. Explore how a workplace assessment rule performs across different team sizes and score distributions.
What the simulation revealed. In a score-level simulation of 138 teams, 67 had a sufficiently high average score, but only 17 also kept low-scoring respondents within the 10% limit. When lower-scoring members were less likely to respond, teams appeared to perform better even though their underlying scores had not changed.
What it can inform. How to report team averages alongside the share of low-scoring respondents, and when incomplete participation makes a result unreliable. These simulations help examine the assessment rules before validating them with real workforce data.
The sections that follow explain how we get from a request to findings like these.
What We Do: Exploring Real-World Questions
Requests to MatrAIx begin with something that someone wants to understand: how people might react to a new idea, which version they prefer, or whether an experience works differently for different groups. We turn these requests into structured experiments using LLM-based agents with persona profiles. Each experiment is organized around two dimensions: who takes part and what they encounter. We call a group of simulated personas a cohort, and the material or experience they encounter a stimulus. Together, these two dimensions give us four broad experiment designs:
cohort
Explore responses
How does one group respond to an idea or experience?
Illustrated caseProfessional-network signup

Case questionWould users start signup?
Compare alternatives
How does one group respond to different versions?
Illustrated caseService-letter wording
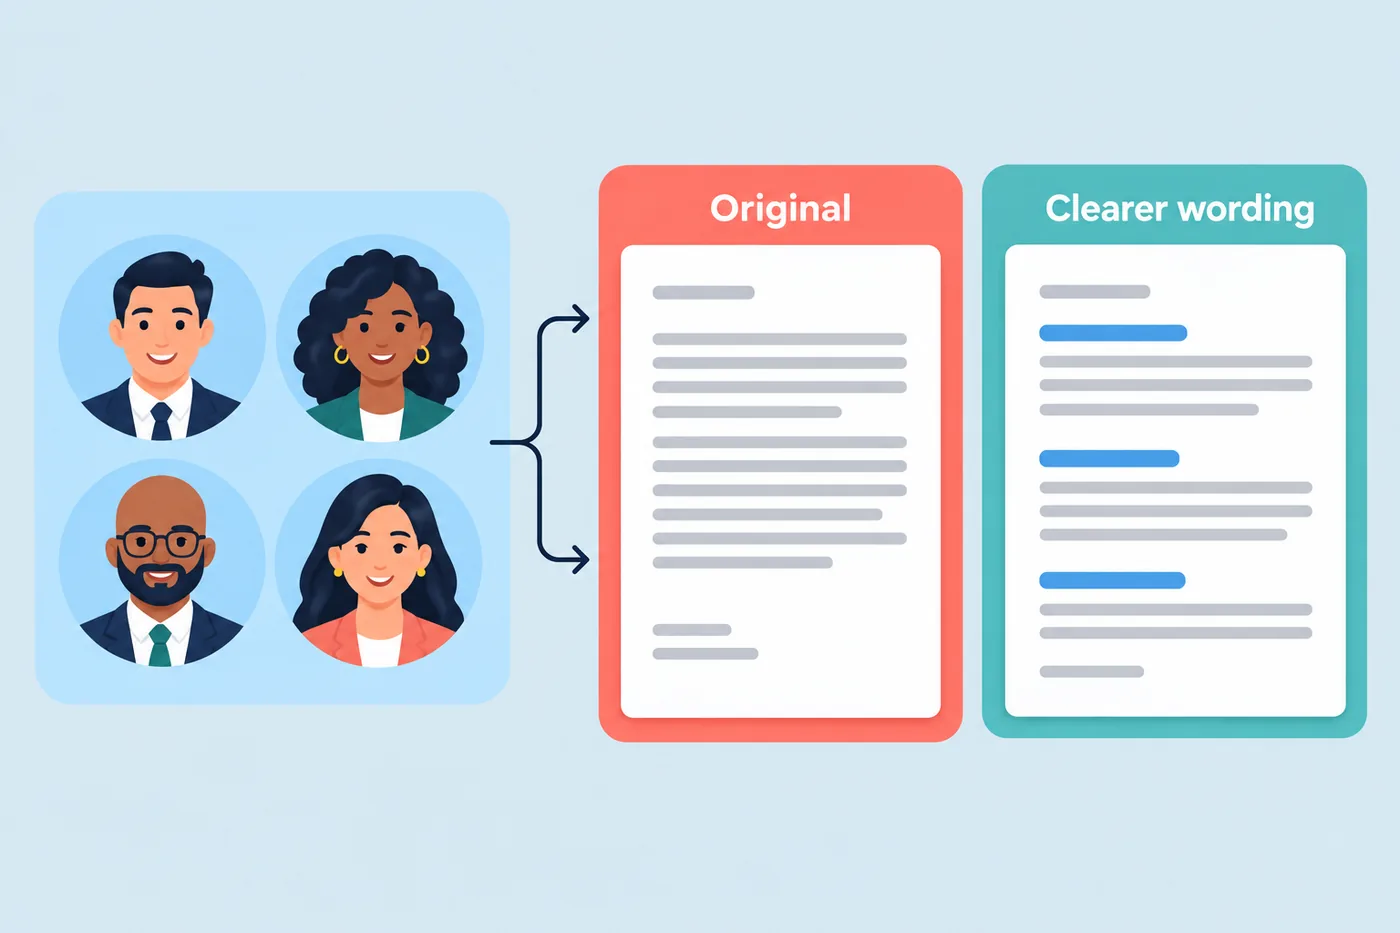
Case questionDoes clearer wording improve willingness to sign?
cohorts
Compare groups
How do different groups respond to the same experience?
Illustrated caseResearch-funding choice
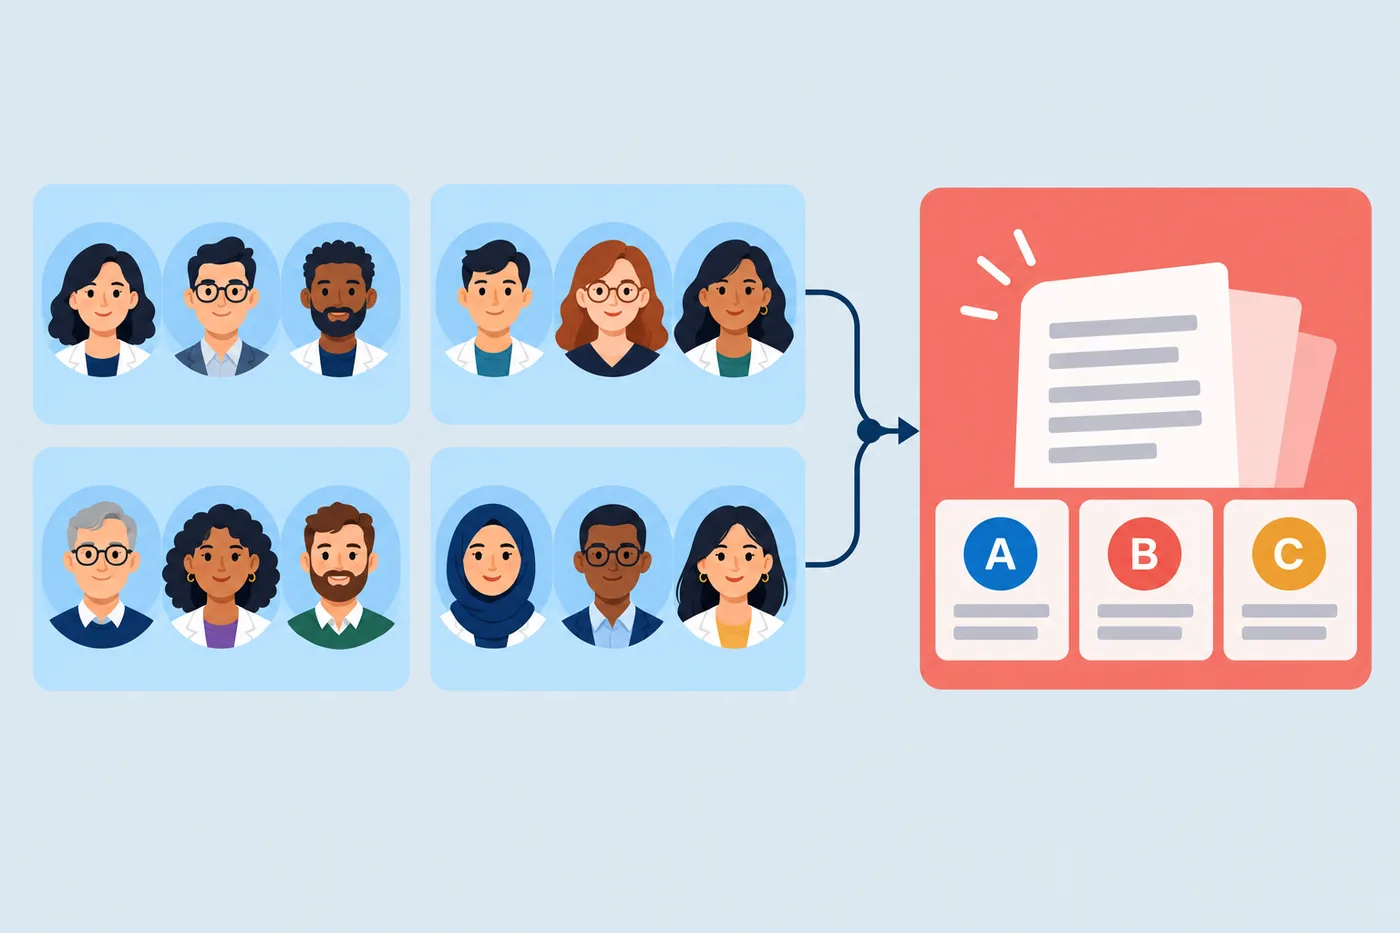
Case questionDo professional groups choose differently?
Compare alternatives across groups
Which version performs better for which group, on the outcomes being measured?
Illustrated caseService-contract acceptance
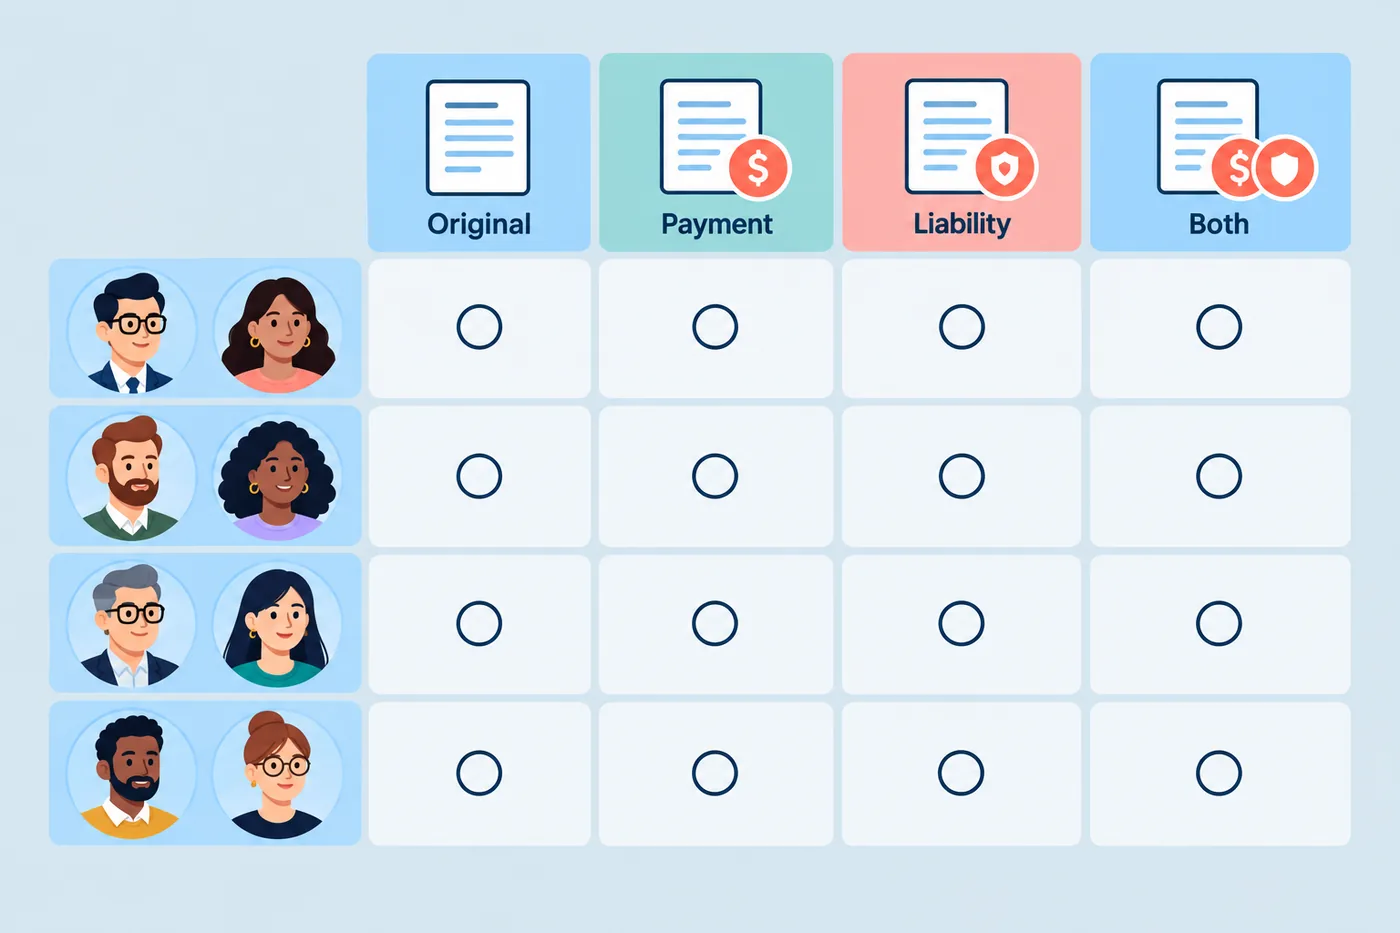
Case questionWhich terms work better for whom?
These illustrations are inspired by real use cases with identifying details omitted. They show study designs; avatars are fictional and their counts are symbolic.
The chosen design determines what changes between experimental conditions and what stays consistent. When comparing stimuli, we generally keep the task and cohort composition consistent. When comparing cohorts, we generally give each group the same stimulus and task. These choices make differences in the simulated responses interpretable.
How We Design: From Real-World Questions to Structured Experiments
Every experiment starts with two choices: who to simulate and what they will experience. We explain how we build cohorts for our design partners’ questions, prepare the materials they encounter, and provide clear context and instructions without steering their responses.
Constructing the Cohort
Design partners usually describe the people they want to understand in everyday language. Depending on the task type defined in Section 3, an experiment may involve one cohort or several for comparison. The construction of each cohort follows the same process: choose its size, translate the description into persona attributes, and set the proportions those attributes should follow.
Choosing the cohort size
The cohort size depends on what the experiment aims to reveal. For controlled comparisons, sample-size planning draws on established A/B and A/B/n testing methods. The primary outcome and the smallest difference that would matter to the design partner guide a statistical power analysis, which estimates how many personas are needed under the study’s assumptions. For exploratory studies, the focus is on covering relevant groups and obtaining stable summary patterns.
Translating the description into persona attributes
We first look for an exact match: an attribute within MatrAIx’s 1,290 persona dimensions that directly represents the relevant part of the design partner’s description. When no exact match is available, we look within those same dimensions for one or more related attributes that can provide a useful approximation, called a proxy.
For each part of the request, use the first approach that represents it adequately.
Exact match
An attribute within our 1,290 dimensions directly represents the requested detail.
age_bracket: ["18-24", "25-34"]↓ No direct match? Consider related attributes.
Proxy
One or more attributes within the same 1,290 dimensions provide a useful approximation.
lstyle_music_listening: ["All day", "Daily"]Frequent listening approximates engagement; it is not an equivalent measure.Examples are illustrative. A proxy approximates the requested concept and should be interpreted with its limitations in mind.
Choosing the cohort’s composition
With the persona attributes defined, the next step is to set the proportion of the cohort with each attribute value. These proportions reflect the design partner’s requirements, relevant human data, and the experiment’s purpose.
Select an approach to see its illustration, what it means, and an example from a design partner.
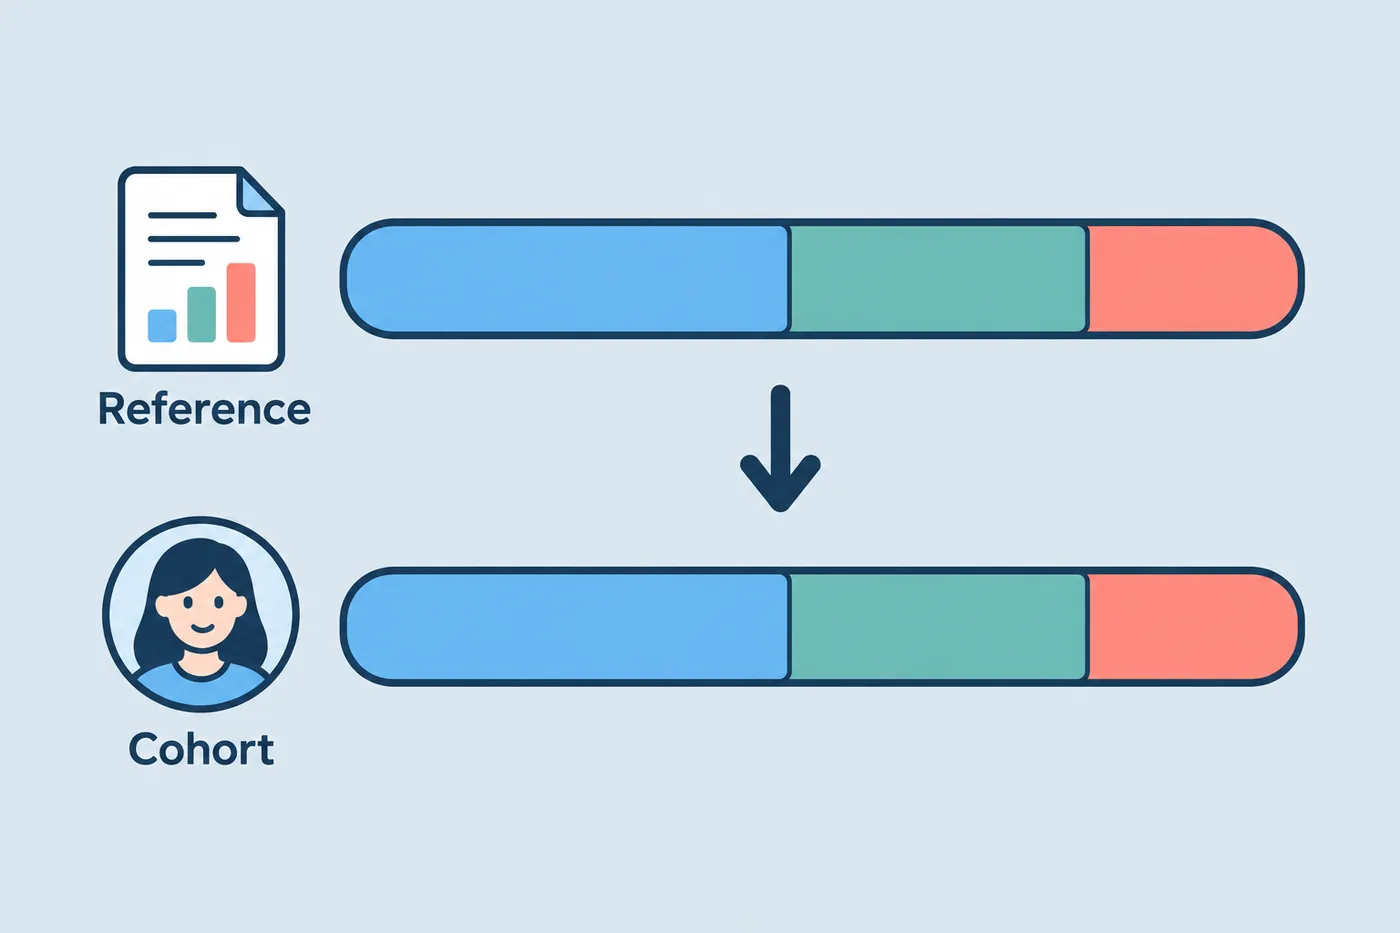
01 Reference-data-informed
Set proportions using relevant human data.
How we set the composition
Use relevant human data to set target proportions for selected persona attributes.
From a design partner request
For a healthcare project, the cohort composition plan draws on published population and clinical-study data to set age, BMI, sex, race or ethnicity distributions for the intended study population.

02 Balanced comparison
Give comparison groups equal or similar representation.
How we set the composition
Assign equal or similar proportions to the groups being compared, giving each group comparable representation in the analysis.
From a design partner request
A research-assistant study compares how senior researchers, wet-lab trainees, computational biologists, and molecular geneticists respond to the same experimental recommendation from an AI assistant. The cohort composition plan assigns equal numbers of personas to these four researcher profiles.
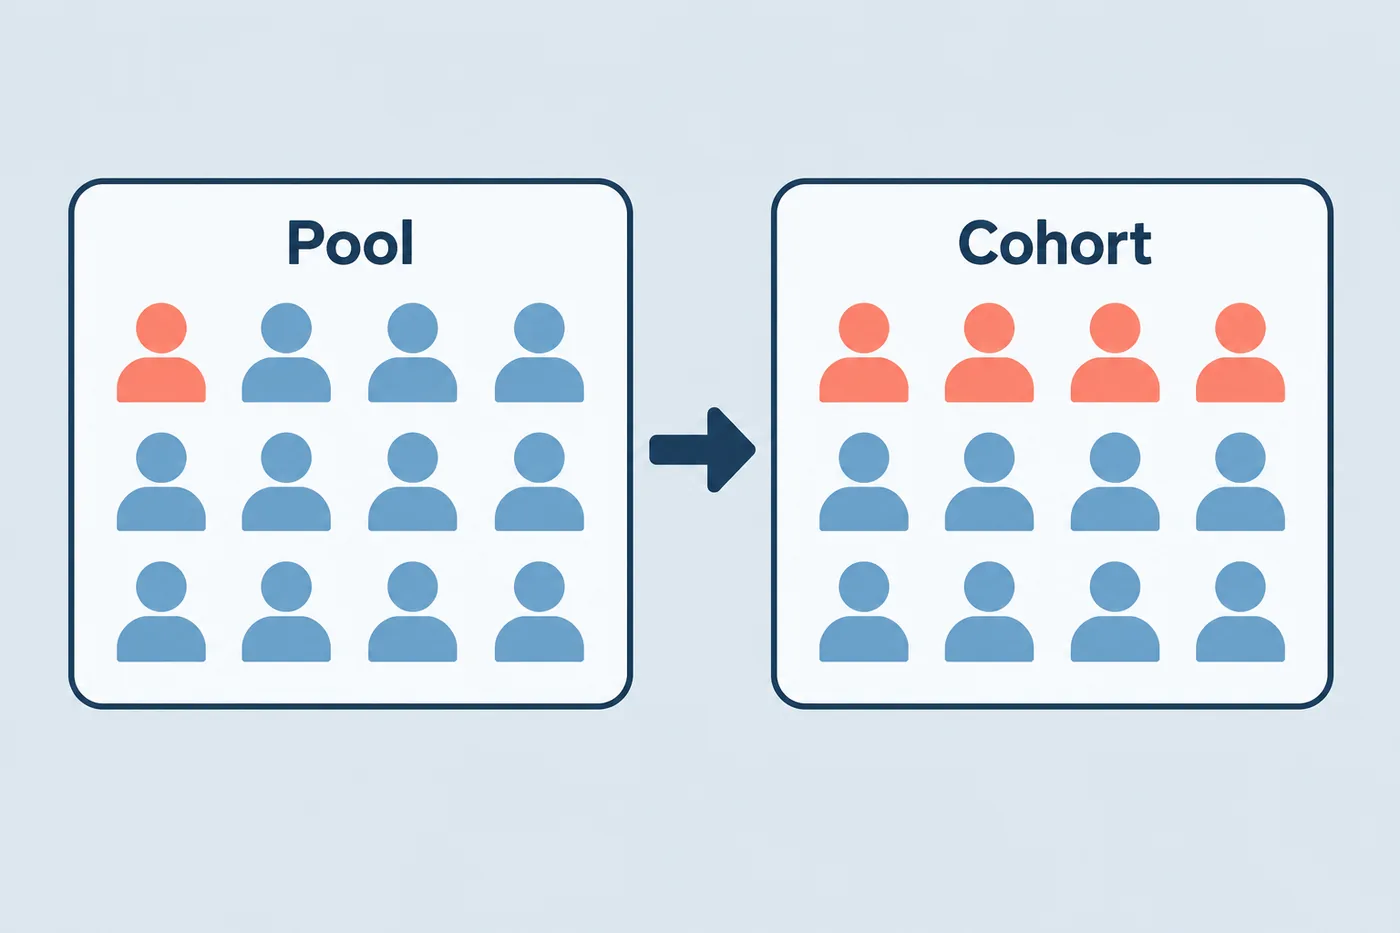
03 Targeted oversampling
Include more personas from otherwise underrepresented groups.
How we set the composition
Increase the proportion of an important group that would otherwise have too few personas to analyze separately.
From a design partner request
A design partner is exploring a service that lets users hire local agents to inspect vehicles, properties, suppliers, or documents on their behalf. Because personas with relevant transaction experience are uncommon in the general pool, the cohort plan increases their share to support more reliable analysis of this group’s simulated responses.

04 Broad coverage
Represent a wide range of backgrounds and circumstances.
How we set the composition
Distribute personas across a wide range of relevant backgrounds and circumstances, ensuring sufficient representation without aiming to reproduce real-world distributions.
From a design partner request
A professional networking study explores how users with different backgrounds respond to the platform. The cohort plan includes a broad mix of demographic backgrounds, professional roles, and levels of digital experience.
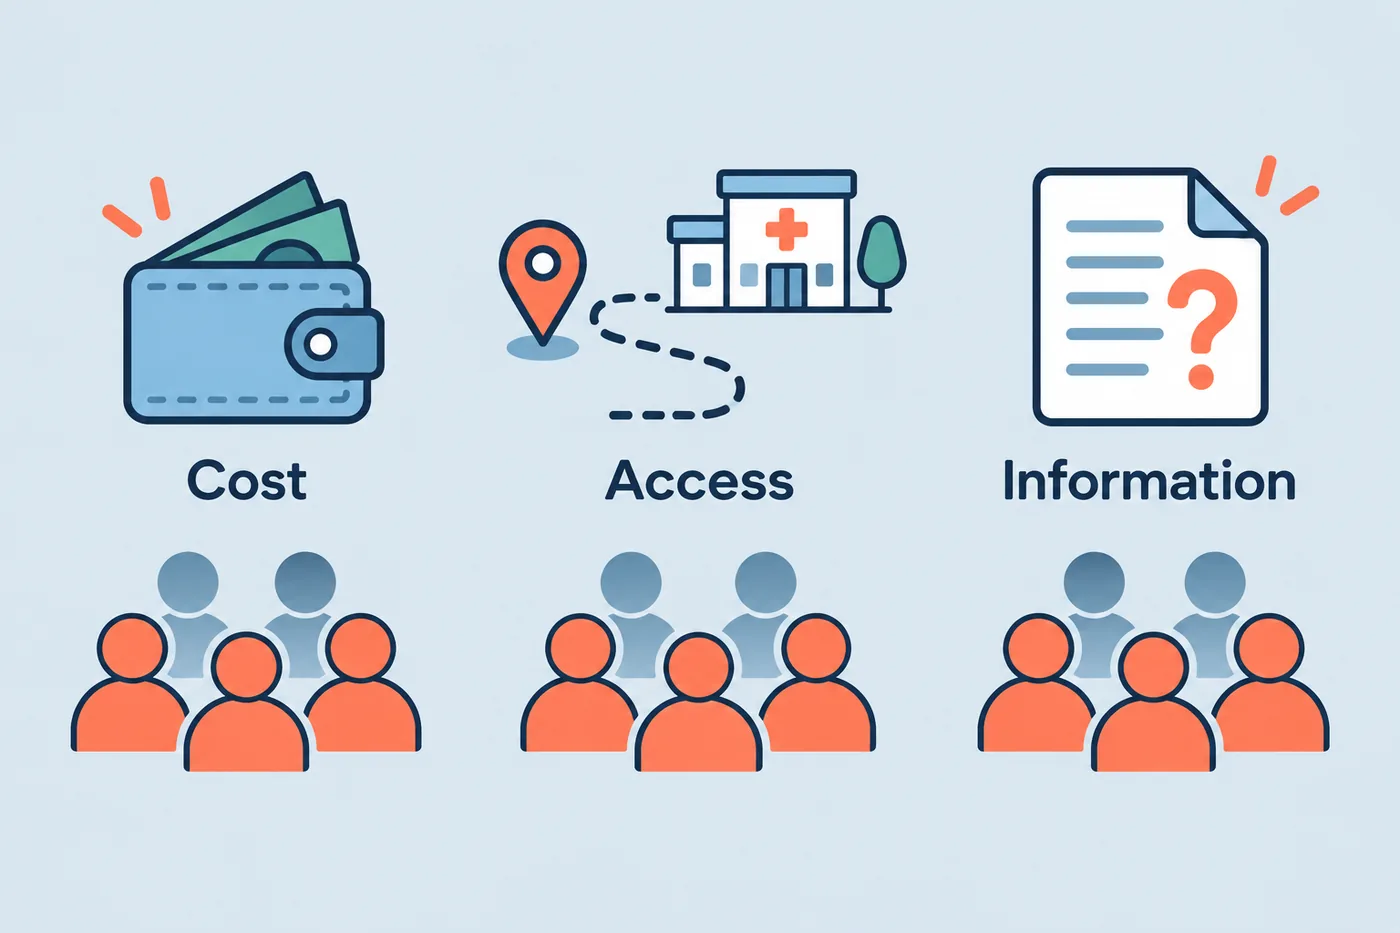
05 Stress-test
Include more personas facing task-relevant challenges.
How we set the composition
Increase the proportion of personas facing task-relevant challenges to explore where the experience may become difficult or fail.
From a design partner request
A stress-test cohort for a community-health study would include a higher proportion of personas facing affordability constraints, limited access to care, or difficulty understanding health information.
Illustrations are schematic; colors and avatar counts do not represent study data or real people. Approaches may be adapted or combined to suit the study.
Constructing and checking the final cohort
With the size, attributes and target composition defined, we build the cohort and check that personas have the requested attributes and that each group appears in the intended proportions. If not, we adjust and check again before running the experiment.
Preparing the Stimuli and Agent Inputs
After constructing the cohort, we prepare the stimuli and agent inputs. The stimuli are the materials or experiences being evaluated. Depending on the task type defined in Section 3, the experiment uses one stimulus or compares several, with clear distinctions between what changes and what stays the same.
The agent inputs provide the context and instructions personas need to participate. These vary by interaction format: a survey might ask personas to read a description and answer questions; a website or application task might specify a starting point and goal; and a chatbot task might describe a situation to seek help with and when to end the conversation. Across these formats, we provide enough information for personas to participate without suggesting what their answers or choices should be.
Survey
A concept, message, or scenario presented for feedback. The questionnaire itself may also be evaluated.
The situation to consider and the questions to answer.
Web
A website, page, or interface design.
Why they are visiting, where to begin, and what they are trying to accomplish.
Chatbot
A conversation with the chatbot, including its responses.
The situation they need help with, their goal, and when to end the conversation.
App
An application feature or workflow.
The starting situation, available actions, and task to attempt.
What We Deliver: Results That Inform Real-World Decisions
Reporting connects each experiment back to what the design partner wants to understand. We present results at three levels: individual responses, cohort-level summaries, and comparisons across cohorts or stimuli. We also examine how sensitive the findings are to the simulation setup.
Throughout this section, we use an exploratory study contributed by an Indian AI-enablement company as a running example. The practical question is how a Chartered Accountant could improve a fee proposal before presenting it to clients: which terms might prompt negotiation, and which changes could make the proposal more acceptable?
Following the one-cohort, multiple-stimuli design introduced in Section 3, one group of 400 simulated Indian business owners and finance leads evaluate four versions of an engagement letter. Created as teaching material with fictional commercial assumptions, the versions vary the payment schedule and liability limit. Each simulated client indicates their willingness to sign, requests any changes, and rates the firm’s trustworthiness and credibility on a scale from 1 to 5.
Here, the main comparison is between the original letter and a revised version with a lower upfront payment and a broader liability cap.
Results at Three Levels
Different questions call for different views of the results. The cards below use the engagement-letter study to show what we report at each level.
Individual response
Each persona’s responses, choices, or actions, with explanations where collected.
One simulated finance professional requested major renegotiation, raising concerns about the liability cap and upfront payment, and rated trust in the firm at 3 out of 5.
Cohort patterns
Overall response patterns and variation within the cohort.
For a particular version of the engagement letter, 23% of the 400 simulated clients requested minor changes and 77% sought major renegotiation. The average trust rating was 3.21 out of 5.
Comparative results
Differences in outcomes across cohorts or stimuli.
Comparing the original letter with a version that changes both the payment schedule and liability cap, minor-change responses rose from 0% to 23%, and the average trust rating increased from 3.03 to 3.21 out of 5.
Three reporting levels illustrated by the exploratory engagement-letter study. Results describe a balanced synthetic cohort under one model configuration; they are not estimates of real-client acceptance.
From Simulation Results to Business Decision
Bringing these views together, the cards below highlight selected findings from this study and the decisions they can inform.
Synthetic results · GPT-6 Astra · 400 personas
Revising payment and liability terms reduced negotiation needs
With the revised letter, 23% of simulated clients shifted from major renegotiation to requesting only minor changes, while 77% still sought major renegotiation.
Minor-change responses
What could this inform?
Whether the revised proposal needs further refinement before seeking client feedback.
Liability changes had the larger effect
Across the four letter versions, revising liability terms had a larger effect on willingness to proceed than revising the payment schedule.
Increase in sign-or-minor-change responses
Average effects across the other term’s two settings. pp = percentage points.
What could this inform?
Whether to prioritize liability terms in proposal revisions and negotiation preparation, subject to professional review of the risks the firm can reasonably accept.
Lower upfront payments made the schedule more workable
With liability terms held constant, lowering the upfront payment increased the share of simulated clients who found the payment schedule acceptable without changes.
Payment workable without adjustment
What could this inform?
Whether to offer the revised payment schedule, taking the firm’s cash-flow needs into account.
Exploratory synthetic findings under one model configuration. The study uses fictional commercial assumptions; real-client responses remain to be evaluated.
These findings are starting points. We next check whether they hold across simulation setups.
Assessing the Robustness of Our Findings
Robustness checks examine whether findings persist across simulation setups or depend on a particular wording, model, or run. We keep the cohorts, stimuli, and tasks the same, then rephrase instructions without changing their meaning, switch the model used to simulate personas, or repeat an identical setup to see how much results vary between runs.
These checks focus on whether the main response patterns, differences between cohorts, and rankings of alternatives remain consistent. When findings change, we explain which settings affect them and how. This separates recurring patterns from setup-sensitive ones.
For example, in the engagement-letter study, GPT 5.6 Sol, GPT 6 Astra and Claude 5 Opus simulated the same 400 personas evaluating four letter versions. The main finding held across all three models: the letter version combining a lower upfront payment with a broader liability cap increased simulated Indian business owners’ willingness to proceed with at most minor changes. This agreement gives the design partner a stronger basis for testing the revised terms with real clients.
Testing the same finding across models
Fixed study setup: the same 400 personas, four letter versions, and intended task.
The direction of the finding was consistent across the three models, although their exact response rates differed. These are synthetic results.
Bring Us Your Question
The cases in this blog are a first look at how we apply MatrAIx to real requests. Simulation is only the first step: we are working with design partners to bring these insights into real decisions, learn from what happens in practice, and refine our simulations with that evidence. If you are exploring an idea and want to understand how people might respond, bring us the question. We would welcome the conversation.
Have a question you would like to explore?Book a demo here
Acknowledgment
We thank CA Nitesh Khandelwal and CA Sonia Gujrati from the AI Lab for contributing the engagement-letter case and for permission to discuss it publicly in this post. We are grateful to Prof. Yixuan He, Shirley Huang, Fangyu Liu, and Shi Bo for their work on the real-world cases featured here; to Dr. Zhixu Silvia Tao and Julie Zhu for authoring the post; to Jianheng Hou for supporting the infrastructure used to run the experiments; to Jintao Huang, Yifan Wang, Qianfeng Wen, Jiahan Li, Yijun Wang, Zibu Wei, and Yilan Fan for their contributions to the MatrAIx community; and to Drs. Yuexing Hao and Xiaomin Li for organizing it.